Introduction
The world is awash in increasingly accessible and increasingly interrelated data. Modern researchers rarely consider data in isolation. In astronomy, for example, researchers often complement newly-collected data with publicly-available survey data targeting a different range of the electromagnetic spectrum. Because of this, new discoveries are increasingly dependent upon interpreting data in the context of other data.
Unfortunately, most of the current interactive tools for data exploration focus on analyzing a single dataset at a time. It is considerably more difficult to explore several conceptually related datasets at once. Scientists typically resort to non-interactive techniques (e.g., writing scripts to produce static visualizations). This slows the pace of investigation, and makes it difficult to uncover subtle relationships between datasets.
To address this shortcoming, we have been developing Glue. Glue is an interactive data visualization environment that focuses on multi-dataset exploration. Glue allows users to specify how different datasets are related, and uses this information to dynamically link and overlay visualizations of several datasets. Glue also integrates into Python-based analysis workflows, and eases the back-and-forth between interactive and non-interactive data analysis.
The Basic Glue Workflow
The central visualization philosophy behind Glue is the idea of linked views -- that is, multiple related representations of a dataset that are dynamically connected, such that interaction with one view affects the appearance of another. For example, a user might create two different scatter plots of a multi-dimensional table, select a particular region of parameter space in one plot, and see the points in that region highlighted in both plots. Linked-view visualizations are especially effective at exploring high-dimensional data. Glue extends this idea to related data sets spread across multiple files.
Let's illustrate the basic Glue workflow with an example. An astronomer is studying Infrared Dark Clouds (environments of star formation) in our Galaxy. Her data sets include a catalog of known Infrared Dark Clouds, a second catalog of "cores" (substructures embedded in these clouds where the stars actually form), and a wide-field infrared survey image of a particular cloud.
Step 1 She begins by loading the cloud catalog into Glue. She creates a scatter plot of the position of each cloud, as well as a histogram showing the distribution of surface densities. She creates each visualization by dragging the data item onto the visualization area. At this point, her screen looks like Figure 1.
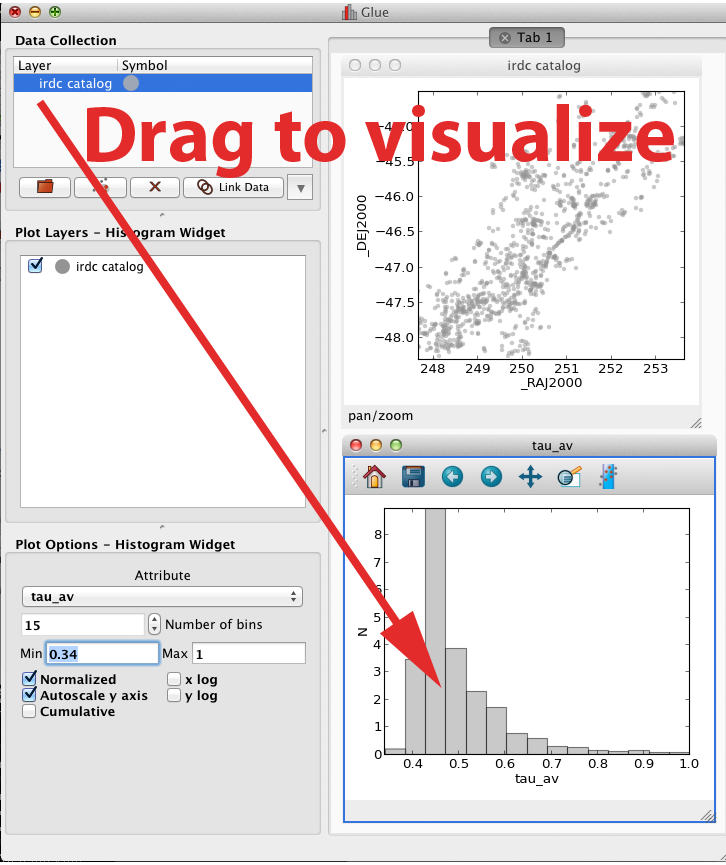
The basic Glue interface, shown at the end of step 1. Datasets are listed on the left panel. Dragging them to the right creates a new visualization.
Step 2 She is interested in a particular region of the sky, and thus draws a lasso around particular points in the scatter plot. This creates a new "subset", which is shown in red on each visualization (Figure 2). If she traces a different region on either plot, the subset will update in both views automatically.
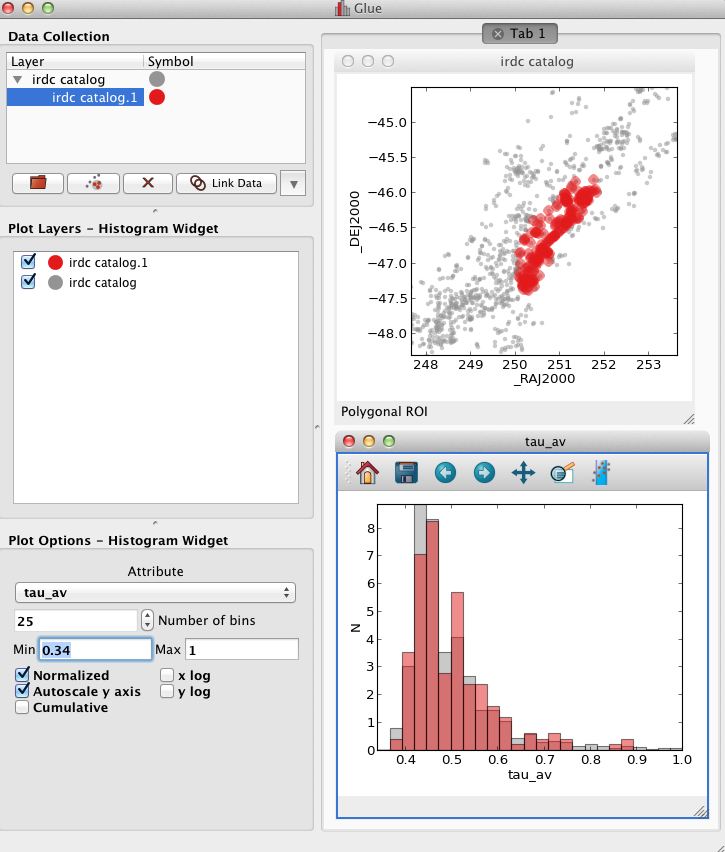
Glue after step 2. Tracing a cluster of points in the scatter plot creates a new subset, The histogram plot updates automatically.
Step 3 Next she loads the infrared image. She would like to see how the points in the catalog relate to structures in the image, by overplotting the subset on the image. To do this, she first "links" the data by defining the logical relationships between the two files. She opens a data linking dialog, which displays the attributes defined for each dataset (Figure 3). The image has attributes for the x and y location of each pixel, and the catalog has columns which list the location of each object in the same coordinate system. She highlights the attribute describing the x location attribute for each dataset (Right Ascension), and "links" them (in effect informing Glue that the two attributes describe the same quantity). She repeats this for the y location attribute (declination), and closes the dialog.
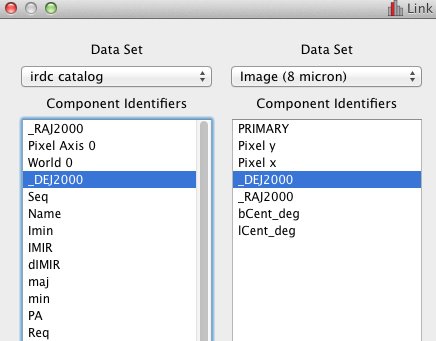
The dialog for expression relationships between different datasets in step 3. Here, both datasets use the same spatial coordinates.
Step 4 Now, she can drag the subset onto the image, to overplot these points at their proper location (this is possible because Glue now has enough information to compute the location of each catalog source in the image. The details of how this is accomplished are described in the next section). All three plots are still linked: if the user highlights a new region in the image, this will redefine the subset and update each plot. Figure 4 shows the Glue interface at this point.
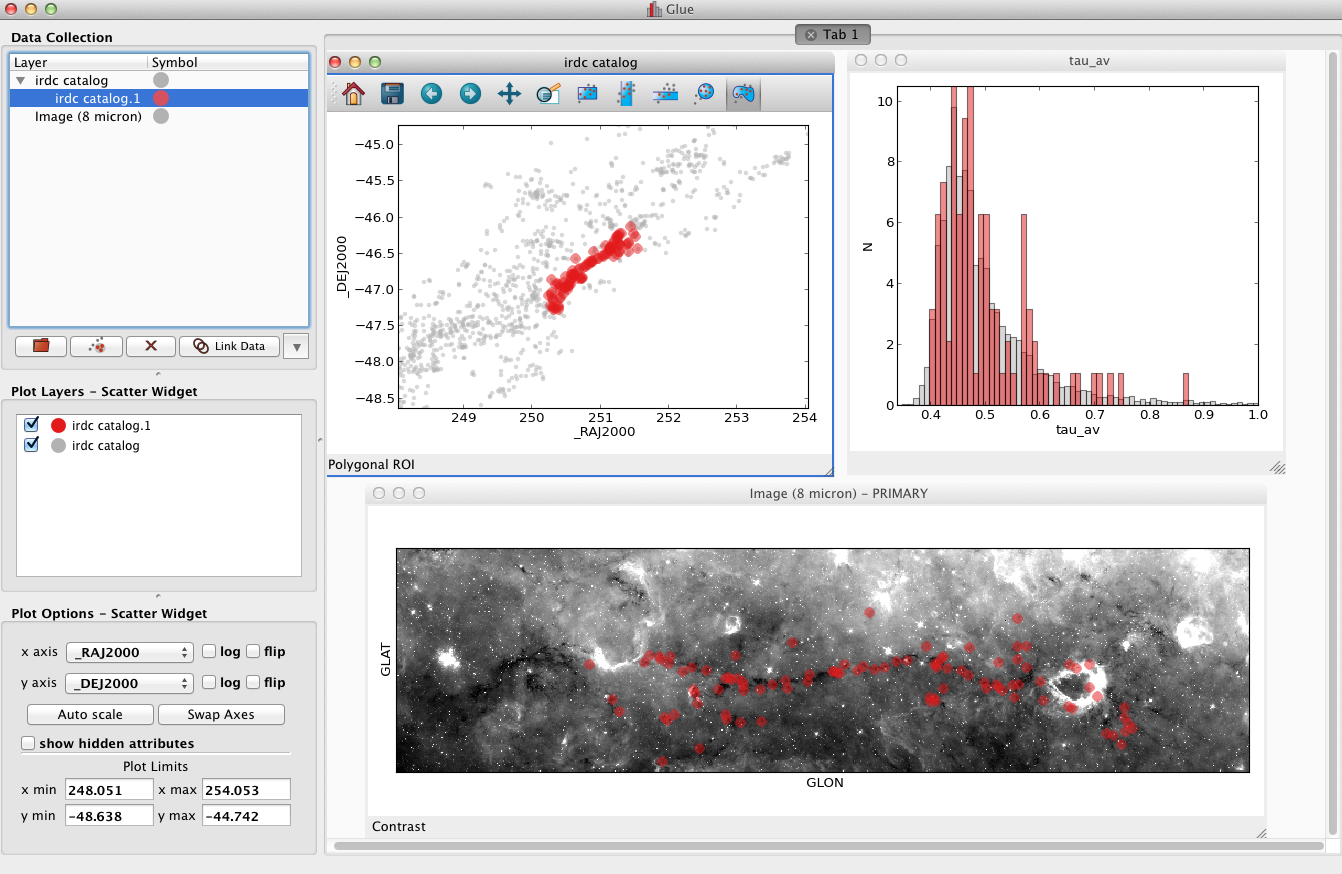
Once the catalog and image are linked, the user can overplot the original subset on the image (step 4).
The relationship between the catalog and image was very simple; each dataset described the same spatial quantities, in the same units. In general, connections between datasets are more complicated. For example, the catalog of cores specifies positions in a different coordinate system. Because of this, Glue allows users to connect quantities across datasets using transformation functions. Glue includes some of these functions by default, but users can also write their own functions for arbitrary transformations. Glue uses these functions as needed to transform quantities between coordinate systems, to correctly overlay visualizations and/or filter data in subsets.
Step 5 Our scientist discovers several interesting relationships between these datasets -- in particular, that several distinct entries in the cloud catalog appear to form a coherent, extended structure in the image. Furthermore, the cores embedded in these clouds all have similar velocities, strengthening the argument that they are related. At this point, she decides to test this hypothesis more rigorously, by comparing to models of structure formation. This analysis will happen outside of Glue. She saves all of her subsets as masks, for followup analysis. Furthermore, she saves the entire Glue session, which allows her to re-load these datasets, dataset connections, and subset definitions at any time.
Eventually, the user annotates several interesting regions in parameter space (step 5). These subsets can be exported as masks for further analysis.
Glue Architecture
The scenario above outlines the basic workflow that Glue enables -- Glue allows users to create interactive linked visualizations, and to drill down into interesting subsets of these visualizations. One of the design priorities in Glue is to keep visualization code as simple and modular as possible, so that adding new visualizations is straightforward. Here we provide an overview of how we have implemented cross-data linking in Glue, while striving to keep visualization code as simple as possible.
Keeping visualizations in-sync is accomplished with the publish/subscribe pattern. Glue defines several standard messages that communicate state changes (e.g., that a subset definition has been changed, a subset has been added or removed, etc.). Visualization clients attach callback methods to a central hub; these callback methods are meant to respond to a particular type of state change (e.g., to change the appearance of a plot). The hub is responsible for broadcasting messages it receives -- in effect, calling each callback function registered with a particular message. Thus, to stay synchronized, a visualization client simply needs to implement callback functions that handle each type of message, and register these with the hub.
The hub receives messages to broadcast from data and subset objects. The base classes for these objects override the __setattribute__ method, such that state changes automatically send messages to the hub. This means that, in most situations, code that edits the state (for example, code that translates user-drawn regions-of-interest to subset definitions) need not manually broadcast messages.
Glue enables data linking across files by providing a simple, dictionary-like interface for accessing attributes from data. For example, consider the case where a user overplots a catalog on top of an image. Such an overlay requires knowledge of the location of each catalog entry in the pixel coordinate system of the image. The pseudo-code for the overlay looks like this:
def overplot_catalog(catalog_data):
    try:
        # try to fetch requested quantities
        x = catalog_data['pixel_coord_x']
        y = catalog_data['pixel_coord_y']
    except InvalidAttribute:
        # cannot compute pixel location of catalog
        return
    # x, y are numpy arrays
    plot(x, y)
In other words, visualization code simply looks up the information it needs. Behind the scenes, the data object is responsible for retrieving and/or computing this quantity, and returning a NumPy array. If it cannot do this, it raises an InvalidAttribute exception, which visualization code responds to. Importantly, visualization code is not responsible for performing coordinate transformations.
Subsets also rely on this interface for filtering data. Each subset stores its logical definition as a subset state. Fundamentally, subset states are combinations of inequalities. Each subset state has a to_mask method that is capable of filtering a given dataset. For example, the implementation of a simple inequality subset state looks like this:
class GreaterThanSubsetState(SubsetState):

    def __init__(self, attribute, threshold):
        self.attribute = attribute
        self.threshold = threshold

    def to_mask(self, data):
        # uses the data dictionary interface
        return data[self.attribute] > self.threshold
Because subset states retain the information about which quantities they constrain, they can be applied across datasets, provided the quantities that they filter against are defined or computable in the target dataset.
Internally, Glue maintains a graph of coordinate transformation functions when the user defines connections between datasets. The nodes in this graph are all the attributes defined in all datasets, and the edges are translation functions. When client code tries to access a quantity that is not originally stored in a dataset, Glue searches for a path from quantities that are natively present to the requested quantity. If such a path exists, The relevant set of transformation functions are called, and the result is returned.
Integrating with Python Workflows
Python is the language-of-choice for many scientists, and the fact that Glue is written in Python means that it is more easily "hackable" than a typical GUI application. This blurs the boundary between interactive and scripted analysis, and can lead to a more fluid workflow. Here are several examples:
Custom data linking functions Glue allows users to specify arbitrary Python functions to translate between quantities in different datasets. As a simple example, consider a function which translates between pounds and kilograms:
from glue.config import link_function

@link_function(info='Convert pounds to kilograms')
def pounds2kilos(lbs):
    return lbs / 2.2
Link functions accept and return NumPy arrays. The link_function decorator adds this function to the list of translation functions presented in the data linking UI. This code can be put in a configuration file that glue runs on startup.
Custom data loading A traditional weakness of GUIs is their fragility to unanticipated data formats. However, Glue allows users to specify custom data loader methods, to parse data in unrecognized formats. For example, to parse jpeg files:
from glue.config import data_factory
from glue.core import Data
from skimage.io import imread

@data_factory('JPEG Reader', '*.jpg')
def read_jpeg_image(file_name):
    im = imread(file_name)

    return Data(label='Image',
                r=im[:, :, 0],
                g=im[:, :, 1],
                b=im[:, :, 2])
This function parses a data object with three attributes (the red, green, and blue channels). The data_factory decorator adds this function to the data loading user interface.
Setup Scripts Glue can be passed a Python script to run on startup. This can be a convenient way to automate the task of loading and linking several files that are frequently visualized. This addresses another typical pain-point of GUIs -- the repetitive mouse-clicking one has to do every time a GUI is restarted.
Calling Glue from Python Glue can be invoked during a running Python session. Many scientists use Python for data-exploration from the command line (or, more recently, the IPython notebook). Glue can be used to interact with live Python variables. For example, Glue includes a convenience function, qglue, that composes "normal" data objects like NumPy arrays and Pandas DataFrames into Glue objects, and initializes the Glue UI with these variables. qglue is useful for quick questions about multidimensional data that arise mid-analysis.
Similarly, Glue embeds an IPython terminal that gives users access to the Python command line (and Glue variables) during a glue session. Variables in a Glue session can be introspected and analyzed on this command line.
Relationship to Other Efforts
Glue helps researchers uncover the relationships that exist between related datasets. It enables users to easily create multiple linked visualizations which can be used to identify and drill down into interesting data subsets.
Many of the ideas behind Glue are rooted in previous efforts (for a more thorough history from an astronomy perspective, see [Goodman12]). The statistician John Tukey pioneered many of the ideas behind what he termed Exploratory Data Analysis (that is, the open-ended investigation of features in datasets, as distinguished from Confirmatory Data Analysis where specific hypotheses are tested systematically; [Tukey77]). In the early 1970s, he developed the PRIM-9 program, which implemented the idea of creating multiple views of multivariate data, and isolating data subsets. More modern linked-visualization programs influenced by PRIM-9 include GGobi, Spotfire, DataDesk, and Tableau (the first is free and open-source, the latter 3 are commercial).
Within the astronomy community, Topcat and Viewpoints focus on linked visualization of tabular data. Finally, some efforts from the Virtual Observatory community (especially the SAMP protocol) allow different visualization tools to interoperate, and hence provide a limited linked-view environment.
Glue builds upon the ideas developed in these programs in a few key ways. The majority of these linked-view environments focus on the exploration of a single catalog. Glue generalizes this approach in two directions. First, Glue is designed to handle several files at a time, and to visually explore the connections between these files. Second, Glue handles non-tabular data like images -- this is critical for applications in astronomy, medical imaging, and Geographic Information Systems.
The landscape of data is evolving rapidly, and driving revolutions both within and beyond science. The phenomenon of "big data" is one of the most public facets of this revolution. Rapidly growing volumes of data present new engineering challenges for analysis, as well as new opportunities for data-driven decision making. Glue tackles a different but equally important facet of the data revolution, which we call "wide data". Data are becoming increasingly inter-related, and the ability to tease out these connections will enable new discoveries. Glue is a platform for visually and flexibly exploring these relationships.
References
| [Goodman12] | Goodman, Alyssa Principles of high-dimensional data visualization in astronomy Astronomische Nachrichten, Vol. 333, Issue 5-6, p.505 |
| [Tukey77] | Tukey, John Exploratory Data Analysis Addison-Wesley Publishing Company, 1977 |